This post is first of a series of posts on Regional Innovation where we will explore innovation across the United States based on findings from PSF’s Regional Innovation Dashboard.
Access Dashboard HERE and click on the “EXPLORE DASHBOARD” link.
WELCOME TO THE REGIONAL INNOVATION DASHBOARD!
Public Spend Forum (PSF) is thrilled to announce the launch of our new **Regional Innovation Dashboard**— an interactive tool designed to help government innovation and economic development teams, investors and policymakers gain insights into the emerging landscape of technology innovation beyond the typical big cities in the United States.
Discovering and Accelerating Regional Innovation – A Key Objective of the Dashboard
Based on extensive research, comprehensive data collection, and advanced analysis, the Innovation Ecosystem Dashboard ranks the top Regional Innovation Clusters across the United States. Each cluster is based on federally defined Metropolitan Statistical Areas (MSAs). An MSA is a geographical region defined by the U.S. Office of Management and Budget (OMB) that consists of one or more counties (or equivalents) anchored by an urban center with a population of at least 50,000.
The primary goal of this interactive dashboard is to allow users to quickly discover and keep up with innovation taking place across the United States, beyond the known centers of innovation. Ultimately, we hope the insights provided will lead to better alignment of funding, improved collaboration across regional clusters, and acceleration of innovation across the country.
The dashboard allows users to answer several critical questions including:
- Where are emerging clusters of innovation, beyond the larger coastal cities or known centers of innovation?
- What are the respective strengths of each innovation cluster, by technology area and ecosystem characteristics?
- Are there opportunities to better align government investments to emerging clusters where there are increasing amounts of private capital flows and ecosystems?
- What companies, investors, organizations, and other ecosystem members are presented within each innovation cluster?
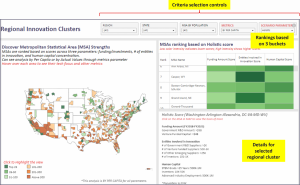
As shown above, users can select various filters and criteria in order to develop their own rankings. This includes:
- Selecting Actual Values (e.g. total $s funded) or Per Capita for rankings – Per Capita allows the discovery of smaller clusters that may be smaller in size yet are generating more innovation impact per person
- Selecting Scenario which include
- Robust Entitities Ecosystem – weighs the # of entities (e.g. startups, investors, researchers) higher
- Robust Funding Amount – weighs the total funding received through government and private capital
- Holistic – weighs Funding, # of Entities and Human Capital all equally
- Selecting Population of an MSA which can help identify top innovation hotspots within smaller clusters
- Region or State to narrow down the results to a specific part of the country
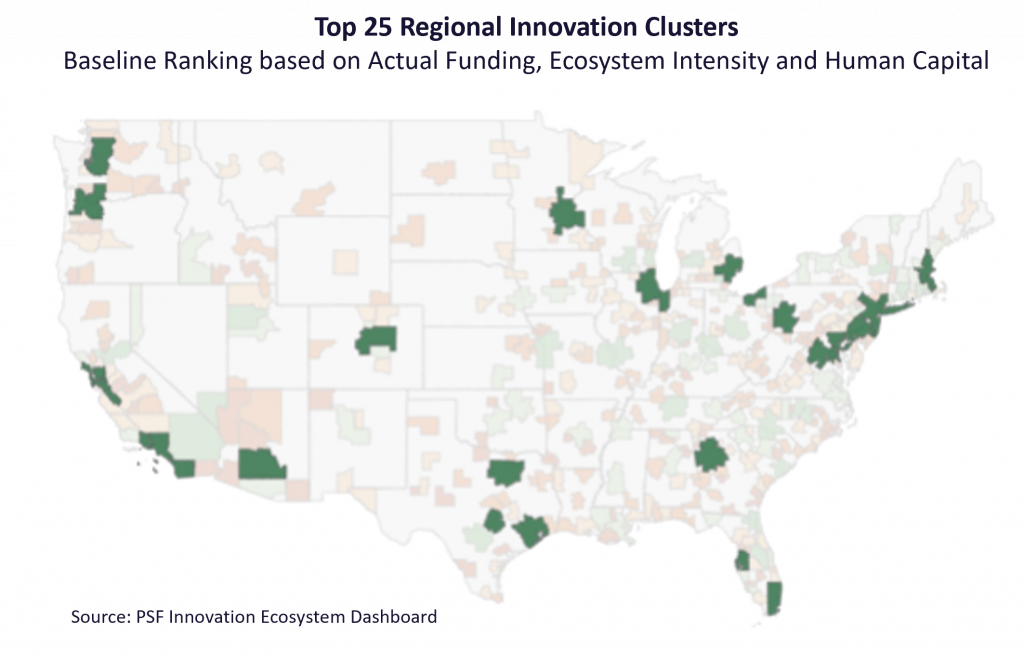
Baseline Rankings – Top 25 R&D Hubs
To start, below we share the first of our rankings based on different scenarios. This is a baseline ranking of the TOP 25 R&D Hubs, based on Actual Values (vs Per Capita)
As expected, leading cities like New York City, San Francisco, Los Angeles, and Boston dominate the top spots. But the data also sheds light on regions that may surprise you—cities like *Pittsburgh, Cleveland, and the Twin Cities are rapidly positioning themselves as major players in their respective fields, from robotics to biomedical engineering.
#1: New York-Newark-Jersey City, NY-NJ-PA –
- Diverse Industry Mix: Strong in fintech, healthcare technology, digital media, and AI and ML. Example: Goldman Sachs and JPMorgan drive fintech innovation through massive data centers.
- Talent Pool: Proximity to elite institutions like Columbia University, NYU, and Princeton ensures a steady flow of skilled tech workers
- Venture Capital: New York consistently ranks 2nd for VC investment, with a heavy focus on fintech and cybersecurity startups
- New Innovation Hubs: Recent initiatives like Newlab and The Grid are promoting cutting-edge technologies such as robotics, AI, and sustainable solutions.
- Existing Innovation Hubs: NYC continues to support a wide range of tech innovations through its robust ecosystem of accelerators, incubators, and economic initiatives, with a focus on tech, fintech, and green technologies.
Sector Focus: Strong emphasis on urban technology, green tech, and diverse tech startups with significant government and institutional support.
#2: San Francisco-Oakland-Berkeley, CA –
- Tech Hub: Home to Google, Apple, and Tesla. It’s a world leader in AI, biotech, and clean energy.
- Venture Capital: The highest concentration of venture capital funding globally, driving AI and clean tech growth
- University Innovation: Research powerhouses like Stanford and UC Berkeley foster cutting-edge research in AI, directly feeding into the local tech ecosystem
- New Innovation Hubs: AI NexusLab and The Vault expansions show an increased focus on AI, fintech, and blockchain, aligning with global tech trends.
- Existing Innovation Hubs: Silicon Valley and the SF Innovation District continue to be at the forefront of tech innovation, nurturing startups in software, AI, and biotechnology.
- Sector Focus: Deeply rooted in software and hardware innovation, with emerging strengths in biotech and financial technologies, benefiting from proximity to major universities and investors.
#3: Los Angeles-Long Beach-Anaheim, CA –
- Creative and Tech Innovation: Known for innovation in entertainment tech, biotech, and aerospace. Hollywood drives advancements in VR and AI for content creation
- R&D Centers: Home to NASA’s Jet Propulsion Laboratory and Silicon Beach, which foster advancements in space tech
- Venture Capital & Clean Tech: Significant growth in VC investment for green energy and clean technology, including EVs and alternative energy.
- New Innovation Hubs: Recent initiatives like Silicon Beach Hub are aimed at media tech and entertainment, capitalizing on LA’s existing strengths in these industries.
- Existing Innovation Hubs: LACI and the Biotech Corridor support a broad range of startups, from clean energy to healthcare, reinforcing LA’s role as a diverse innovation hub.
- Sector Focus: Strong focus on media tech, entertainment, clean energy, and biotech, with ongoing efforts to promote tech skills and entrepreneurship through educational collaborations.
#4 through #25 are listed below. Visit the Dashboard to get further details.
#4: San Jose-Sunnyvale-Santa Clara, CA
#5: Boston-Cambridge-Newton, MA-NH
#6: Chicago-Naperville-Elgin, IL-IN-WI
#7: Washington-Arlington-Alexandria, DC-VA-MD-WV
#8: Dallas-Fort Worth-Arlington, TX
#9: Houston-The Woodlands-Sugar Land, TX
#10: Miami-Fort Lauderdale-Pompano Beach, FL
#11: Philadelphia-Camden-Wilmington, PA-NJ-DE-MD
#12: San Diego-Chula Vista-Carlsbad, CA
#13: Seattle-Tacoma-Bellevue, WA
#14: Denver-Aurora-Lakewood, CO
#15: Atlanta-Sandy Springs-Alpharetta, GA
#16: Detroit-Warren-Dearborn, MI
#17: Minneapolis-St. Paul-Bloomington, MN-WI
#18: Austin-Round Rock-Georgetown, TX
#19: Phoenix-Mesa-Chandler, AZ
#20: Oxnard-Thousand Oaks-Ventura, CA
#21: Baltimore-Columbia-Towson, MD
#22: Pittsburgh, PA
#23: Portland-Vancouver-Hillsboro, OR-WA
#24: Cleveland-Elyria, OH
#25: Tampa-St. Petersburg-Clearwater, FL
Access Dashboard HERE and click on the “EXPLORE DASHBOARD” link.
To stay up to date with the next blogs in this series, make sure to follow Public Spend Forum’s LinkedIn.
Appendix – Methodology and User-Centric Approach
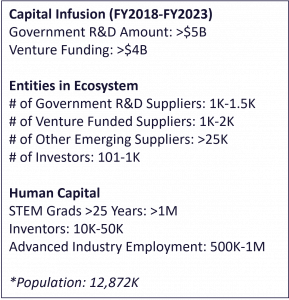
To meet the above goals and objectives, we first validated the characteristics and parameters of innovation ecosystems, such as the robustness of the startup ecosystem, the amount of capital flowing into a region/cluster, amount of talent available to support innovation. In sum, there are 3 large “buckets” of parameters including (1) Robustness of Funding/Capital, (2) Robustness of the ecosystem in terms of startups, capital, and other ecosystem participants, and (2) Robustness of the Human Capital present in the ecosystem.
We then leveraged PSF’s comprehensive market datasets and analytical frameworks to populate ecosystem parameters for each MSA. We then built a flexible framework that allows users to rank MSAs based on their preferences.